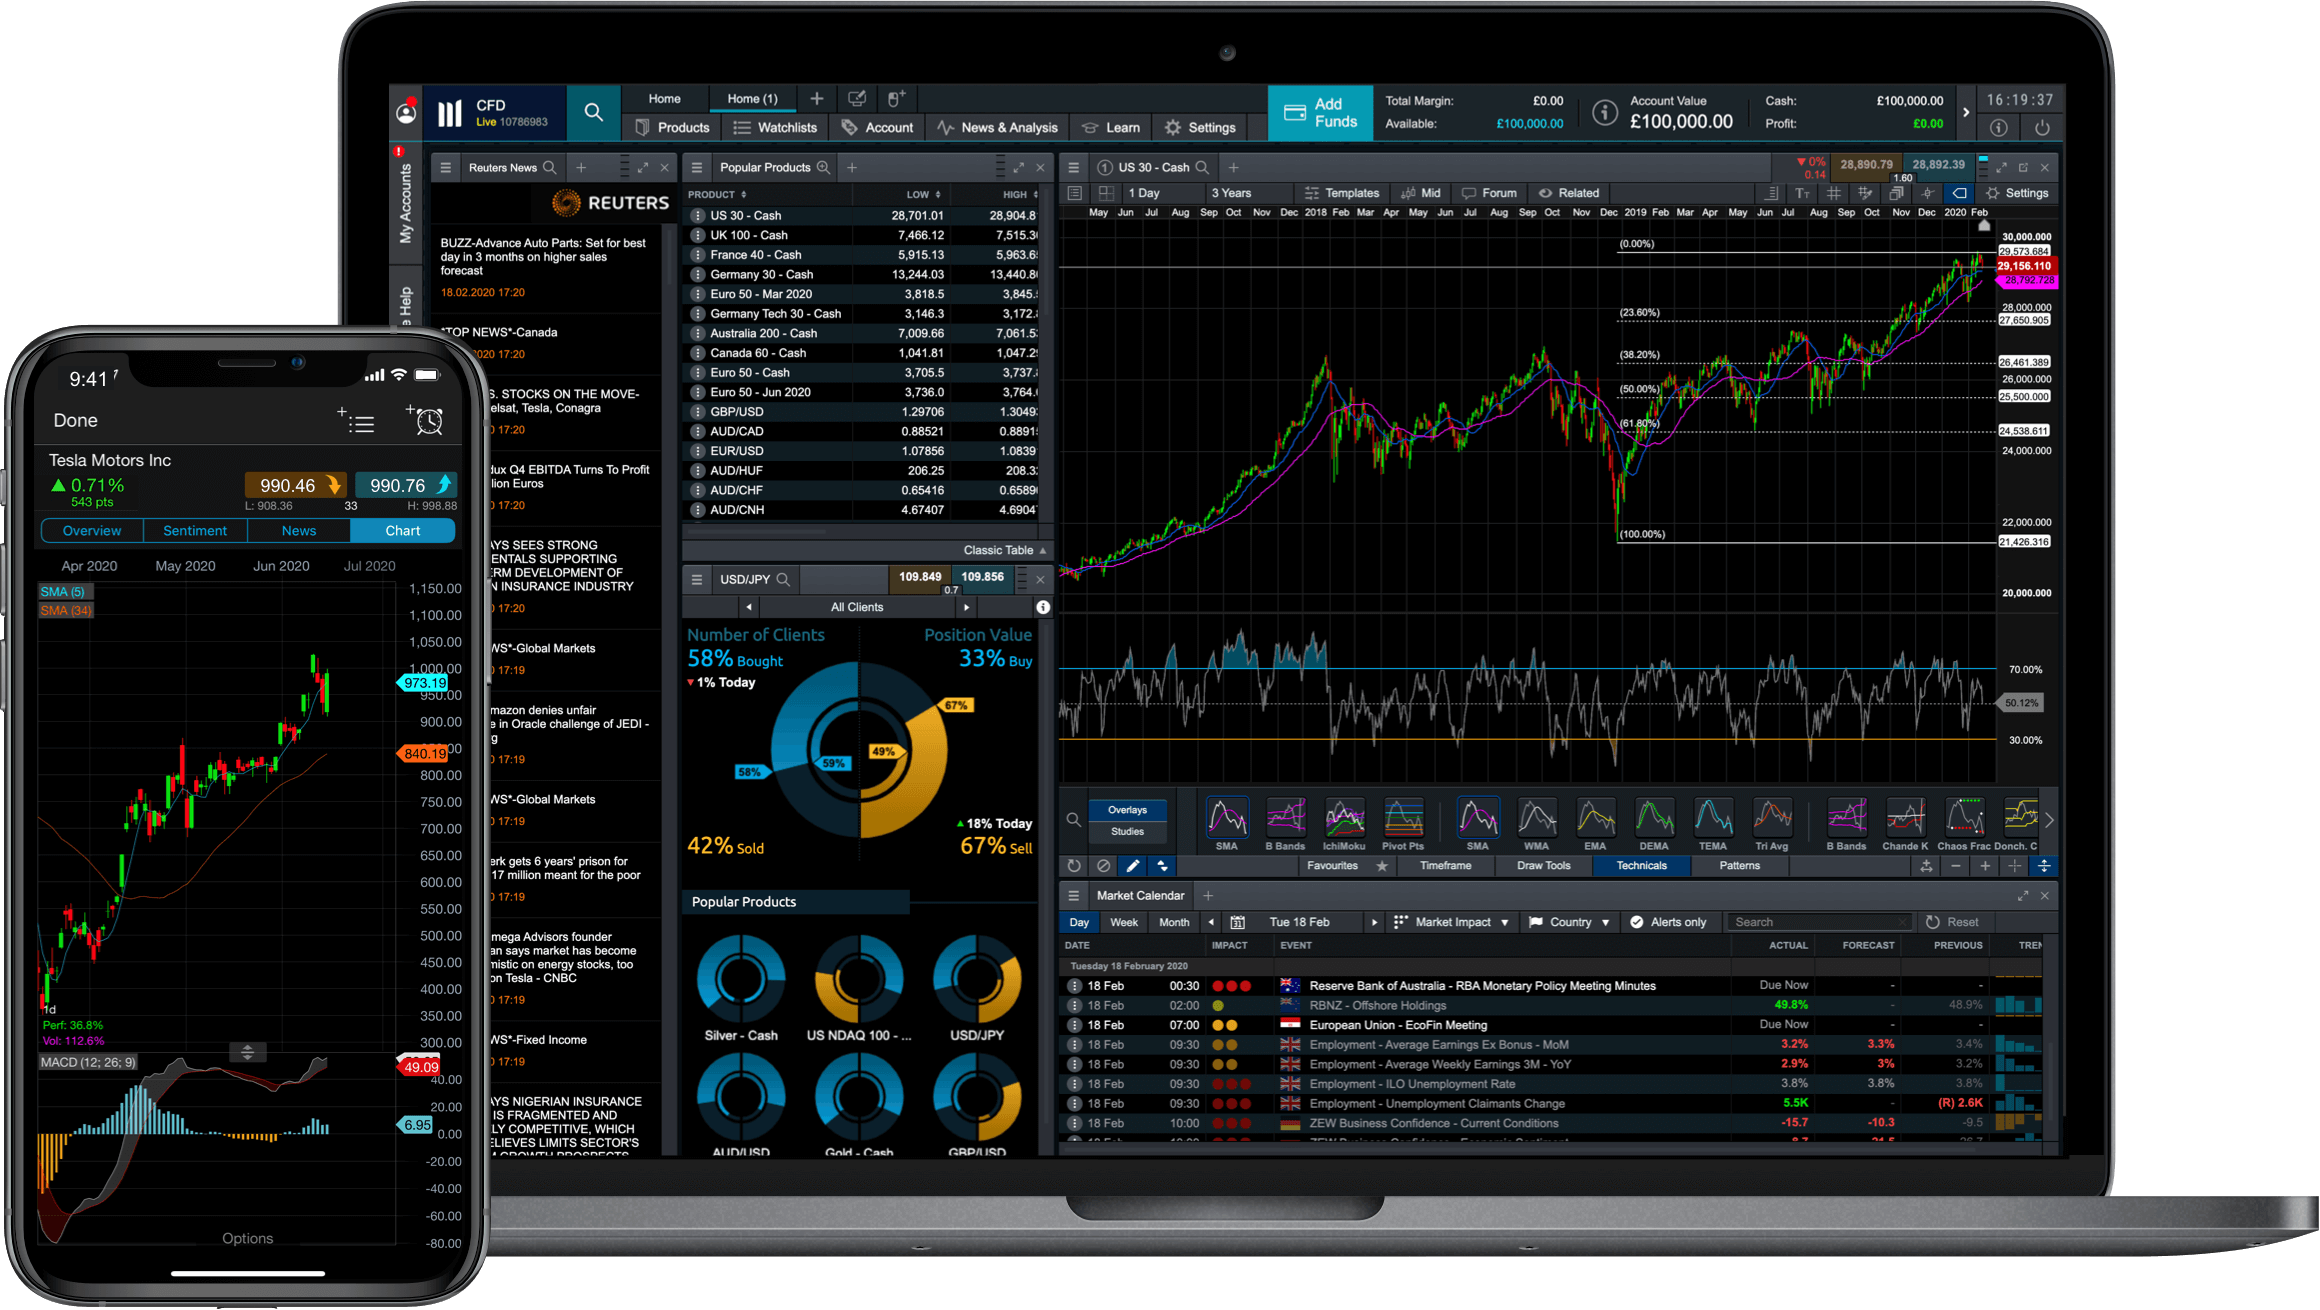
Contracts for Difference (CFDs) offer traders a dynamic and flexible way to speculate on the price movements of various financial instruments without owning the underlying asset. However, mastering CFD trading requires more than just a basic understanding of market mechanics; it demands a strategic approach underpinned by robust technical analysis. In this article, we’ll explore how technical analysis can chart your path to CFD trading mastery.
Understanding Technical Analysis
Technical analysis involves studying historical price and volume data to predict future market movements. Unlike fundamental analysis, which evaluates the intrinsic value of an asset based on economic indicators and financial statements, technical analysis focuses purely on price action and market behavior. The goal is to identify patterns, trends, and signals that can guide trading decisions.
Key Components of Technical Analysis
Price Charts: The cornerstone of technical analysis, price charts visually represent an asset’s historical performance. Common types include line charts, bar charts, and candlestick charts. Each provides a different level of detail, with candlestick charts being particularly popular for their ability to convey information about price movement, including opening, closing, high, and low prices within a specific period.
Trends: Identifying trends is crucial for CFD traders. Trends indicate the general direction in which a market is moving—upward (bullish), downward (bearish), or sideways (range-bound). Tools like trendlines and moving averages help traders recognize and confirm these trends.
Support and Resistance Levels: These are price levels at which an asset tends to stop and reverse direction. Support levels act as a floor preventing the price from falling further, while resistance levels act as a ceiling capping the price rise. Recognizing these levels helps traders make informed entry and exit decisions.
Indicators and Oscillators: Technical indicators are mathematical calculations based on price, volume, or open interest. Common indicators include Moving Averages, Relative Strength Index (RSI), Moving Average Convergence Divergence (MACD), and Bollinger Bands. Oscillators like RSI and MACD help traders identify overbought or oversold conditions, signaling potential reversals.
Patterns: Price patterns such as Head and Shoulders, Double Tops and Bottoms, and Triangles can provide insights into future price movements. Patterns are formations created by the price action on a chart and are used to predict the continuation or reversal of a trend.
Applying Technical Analysis to CFD Trading
Step 1: Chart Selection
Begin by selecting the appropriate chart type and time frame for your trading strategy. For short-term trades, intraday charts like 5-minute or 15-minute intervals can be more useful. For long-term trades, daily or weekly charts provide a broader perspective.
Step 2: Identify Trends
Use trendlines and moving averages to determine the primary trend. A simple moving average can smooth out price data to help identify the direction of the trend. For instance, a 50-day moving average can reveal whether the market is in an uptrend or downtrend.
Step 3: Determine Support and Resistance
Mark key support and resistance levels on your chart. These levels can be identified by looking at previous highs and lows. Traders often place stop-loss orders just below the support level or above the resistance level to manage risk.
Step 4: Use Indicators
Incorporate technical indicators to refine your analysis. For example, an RSI above 70 might indicate an overbought condition, suggesting a potential sell opportunity. Conversely, an RSI below 30 could signal an oversold condition, presenting a buy opportunity.
Step 5: Analyze Patterns
Look for recognizable price patterns that align with your trading strategy. If you spot a Head and Shoulders pattern forming, it might indicate a trend reversal. Confirm this pattern with other indicators before making your trade.
Best Practices for CFD Trading
Stay Disciplined: Stick to your trading plan and avoid emotional decision-making. Set clear entry and exit points based on your technical analysis.
Manage Risk: Use stop-loss orders to protect your capital. Never risk more than a small percentage of your trading account on a single trade.
Keep Learning: Markets are constantly evolving. Stay updated with the latest technical analysis techniques and tools.
Practice Patience: Not every market condition will be favorable for trading. Wait for clear signals and confirmations before entering a trade.
Conclusion
Mastering CFD trading through technical analysis requires dedication, practice, and continuous learning. By understanding price charts, trends, support and resistance levels, indicators, and patterns, you can make more informed trading decisions and enhance your chances of success. Remember, the journey to CFD trading mastery is a marathon, not a sprint. Chart your path with precision, discipline, and patience, and you’ll be well on your way to becoming a proficient CFD trader.
